
After all the work carried out during the last months and culminated in the previous update, I took some time to experiment with some different things. I wanted to leave the rendering side for a bit and take a look at how to optimize other parts of the engine.
I got my hands dirty straightaway with low-level aspects by playing with SIMD intrinsics, both Intel SSE and ARM NEON. The project involved quite a lot of different tasks, such as:
- Looking online for example code (like SSE Quaternion Multiplication or SSE 4x4 Matrix Inversion)
- Implementing functions for both SSE and NEON
- Unit testing my code for correctness and parity against non SIMD one
- Dealing with compilers details (always_inline, Vector Extensions, alignas)
- Analyzing generated assembly on godbolt.org
- Measuring performance on both PC and Android
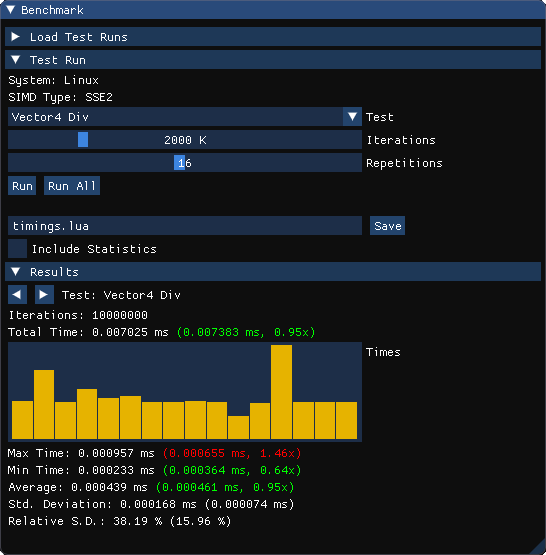
At the end the performances were too close to what the compiler alone could achieve with auto-vectorization and instead of pursuing more optimizations I put the task on hold. It was still a fun and learning experience and it allows me to show you my SIMD benchmark utility. 😄
It is powered by ImGUI, it can load and save data from test runs using Lua and then compare them.
After archiving the simd branch on my repository I jumped on another big project: trying to come up with an ECS implementation for the nCine.
It would flatten the hierarchy of game elements and allow for a faster and possibly multi-threaded approach at updating them.
I have already put together some early tests but before going on I took some days to have a look at some profiling tools. Embedding custom timers and graphs into the engine can be fun, as can be writing ad hoc benchmarks, but for this task I needed something more powerful.
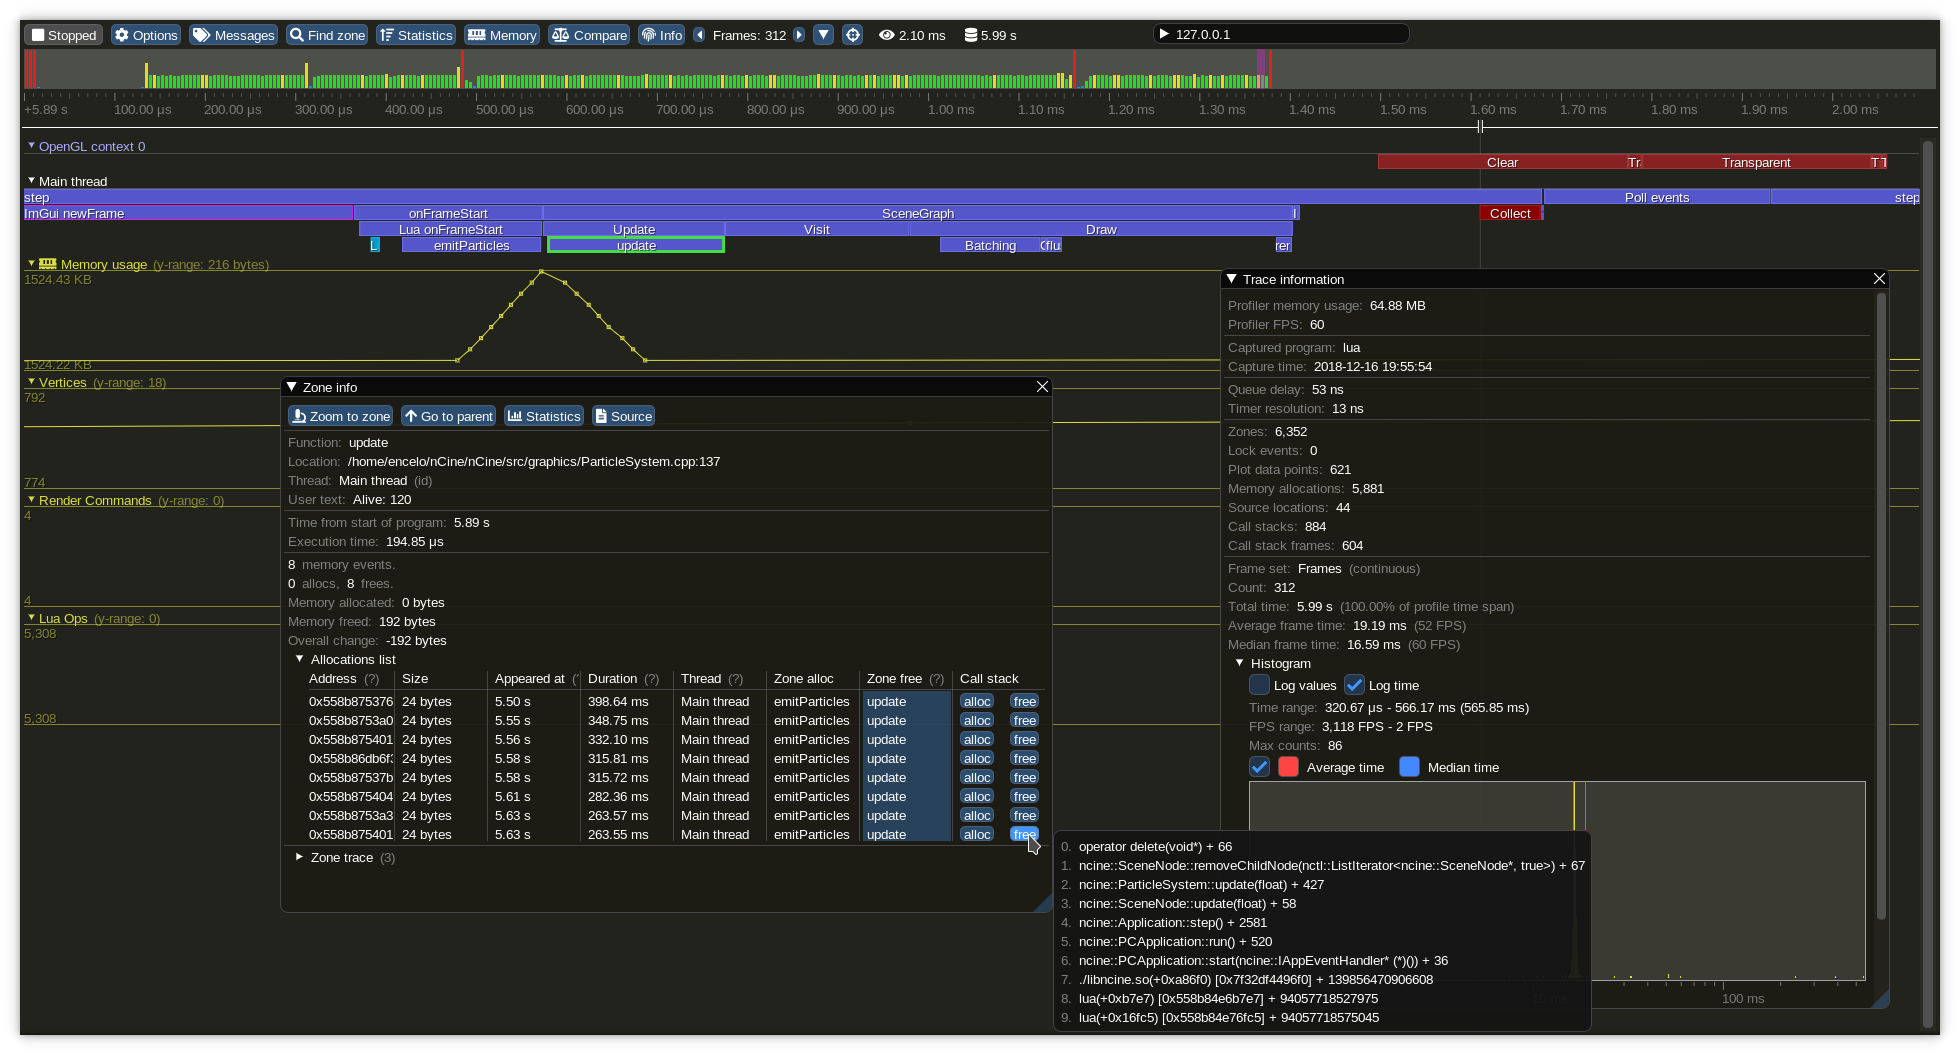
I stumbled upon Tracy, a very capable frame profiler that shows CPU and GPU zones, has Lua instrumentation, annotates allocations and locks and displays call stacks. Instrumentation of user code is easy, capturing data has a very low overhead and works locally or remotely on Linux, Windows, macOS and Android.
The profiler that collects and visualize the data has a super rich ImGui interface with line plots, histograms, colored sections and the ability to compare two captures side by side.
With the integration in place I can now be sure that I will be able to assess any performance change related with big refactorings or optimizations. 💪